
|
Product Lifecycle Management
|
Food & Beverage
|
Blogs
Posted By:
Federico Fontanella, PMP
Since the start of the COVID-19 pandemic, the global economy has endured a series of disruptions that continue to have ripple effects for consumers. And few economic issues of this era have garnered more attention than the persistent run of inflation of the last three years.
In the wake of supply chain disruptions, robust fiscal stimulus, and strong consumer demand for goods, broad-based inflation in the U.S. took hold in 2021. Year-over-year price changes in the Consumer Price Index reached a peak of 9.1% in June 2022. In the ensuing two years, the rate of inflation has slowed but remains above recent historical levels. These effects have placed greater strain on household budgets as goods and services across the board have become more expensive.
Increases in major cost categories like housing and vehicles have contributed substantially to inflation during this time, while sectors like food and energy have seen great volatility in prices. But one other significant source of pressure has been household goods. From technology to clothing to furniture, these items can represent a large chunk of household spending—and, with inflation, a big reason why more households are feeling pinched.
Price Trends for Consumer Goods
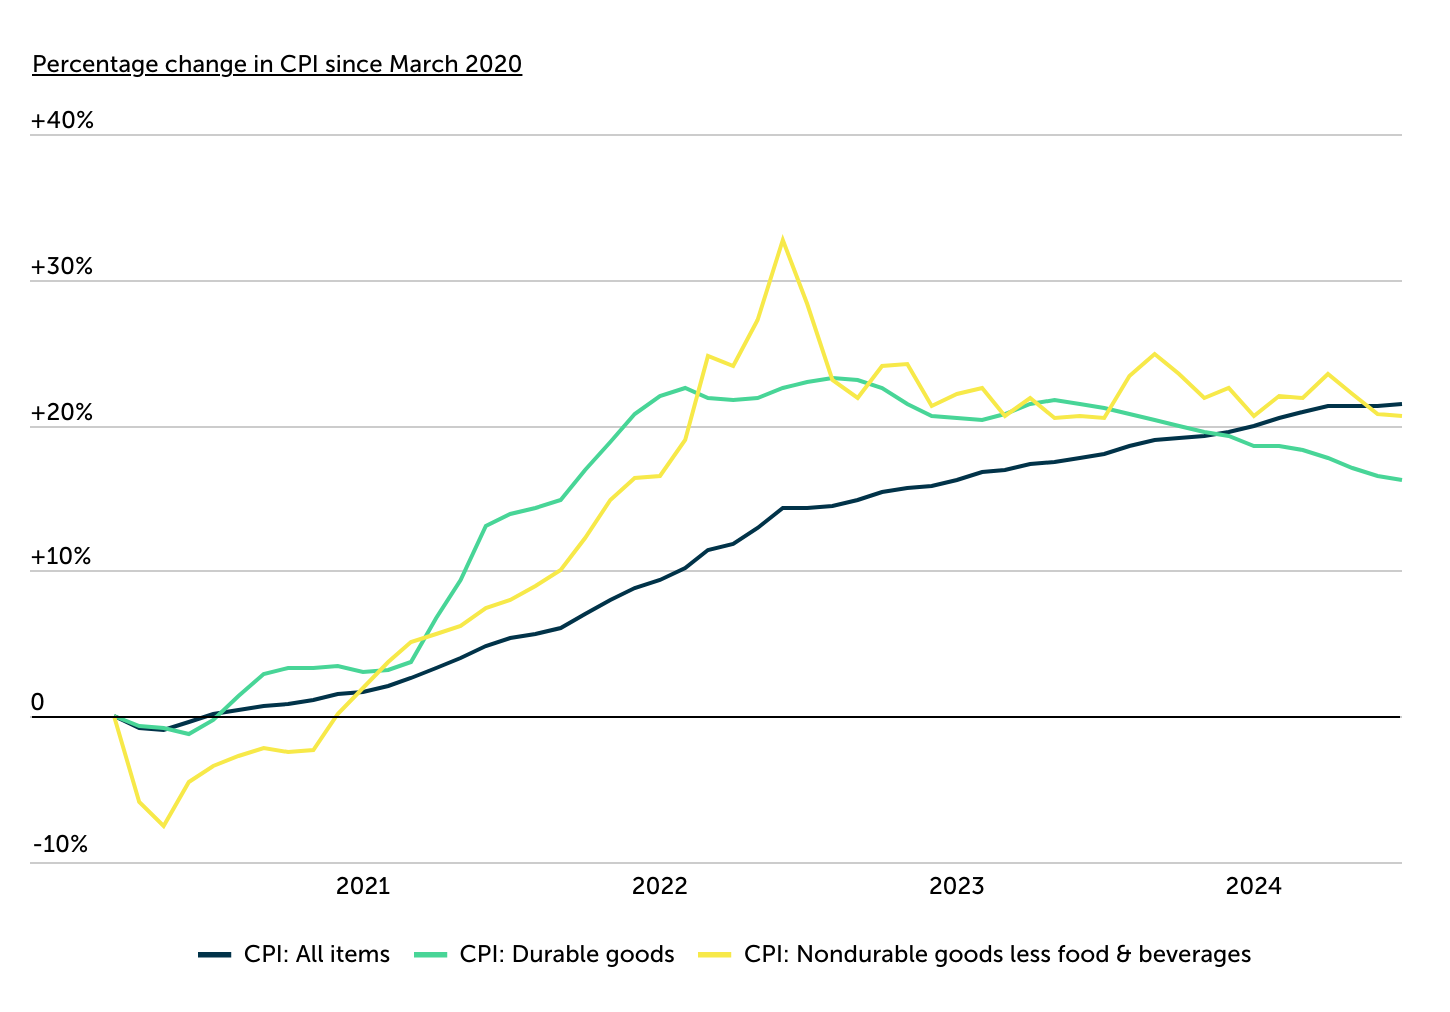
After rapidly outpacing broad inflation, price growth for consumer goods has slowed
Source: Trace One analysis of U.S. Bureau of Labor Statistics data
Household items are typically classified as either durable or nondurable goods. According to the U.S. Bureau of Economic Analysis, durable goods are those tangible products that can be stored or inventoried and that have an average life of at least three years, while nondurable goods have an average life of less than three years. During the initial months of COVID in 2020, both categories experienced a decline in prices as the shock of the pandemic set in. In 2021, strong consumer demand and supply chain disruptions rapidly pushed costs higher, reaching a peak in mid-2022. As supply chains have stabilized and consumer demand has begun to pull back, price increases have leveled out but remain high. Cumulatively, nondurable goods now cost 20.7% more than they did in early 2020, while durable goods are up 16.2%.
DID YOU KNOW?
Product lifecycle management software oversees the entire lifecycle of a product from cradle to grave, integrating a variety of data sources and systems to enhance visibility and traceability. In the food industry, PLM software helps reduce your time to market by optimizing each stage of production.
Spending on Household Items by State
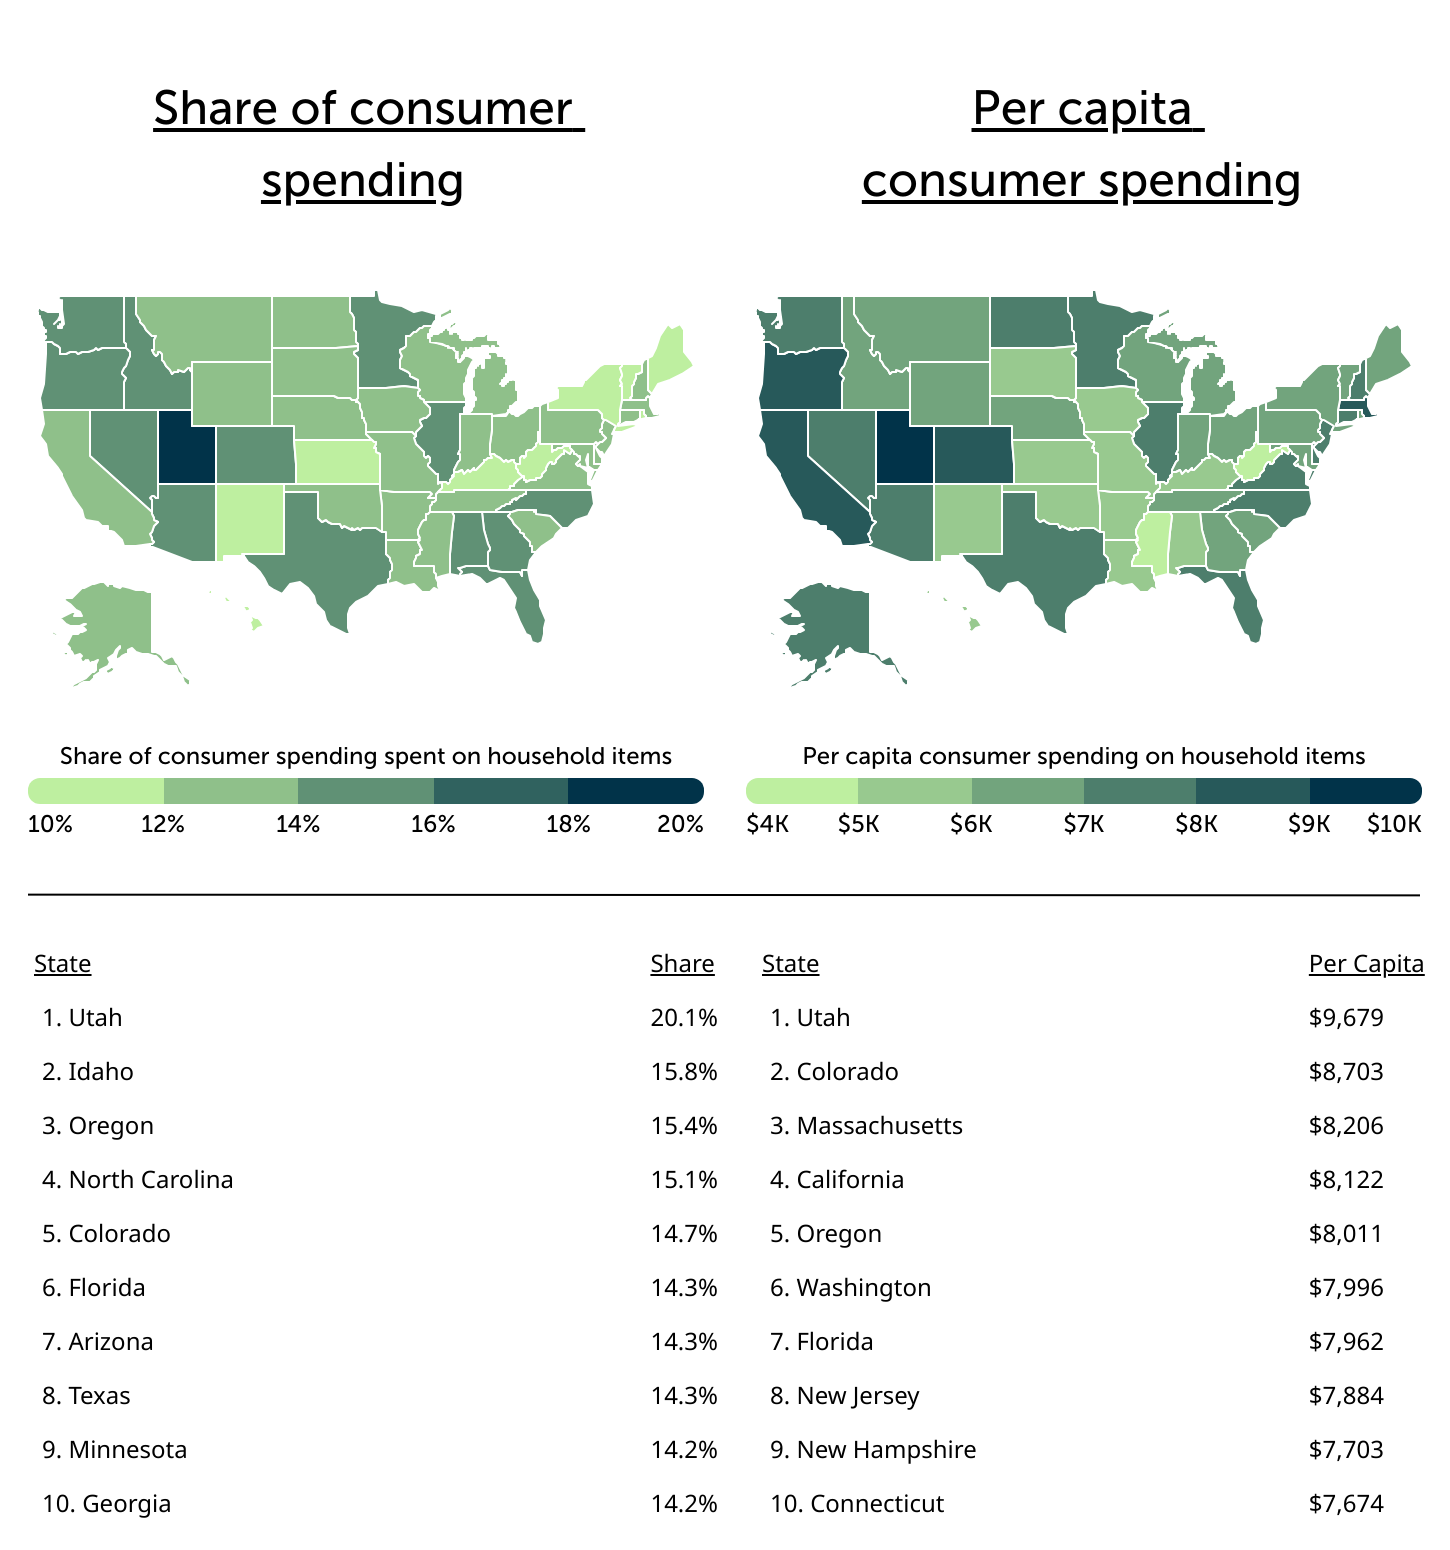
Utah residents spend the most on household items
Source: Trace One analysis of U.S. Bureau of Economic Analysis and U.S. Census Bureau data
The impacts of these price increases have been experienced differently across the U.S., as consumer spending patterns can vary geographically. Utah stands out for its spending on household items, with more than 20% of consumer dollars—or $9,679 per capita—going toward household goods. One potential reason is Utah’s ideal setting for outdoor recreation: Utah’s residents spend 5.7% of their personal spending on sports and recreation equipment and vehicles, more than double the national average of 2.4%.
At the lower end, West Virginia has both the lowest share and per-capita spending on household items in the U.S. at 10.1% and $4,474 respectively. This may be a function of other economic factors: West Virginia and other low-ranking states like Mississippi and New Mexico have lower incomes and higher rates of poverty that make discretionary spending on household items more difficult.
Price Changes for Common Household Items
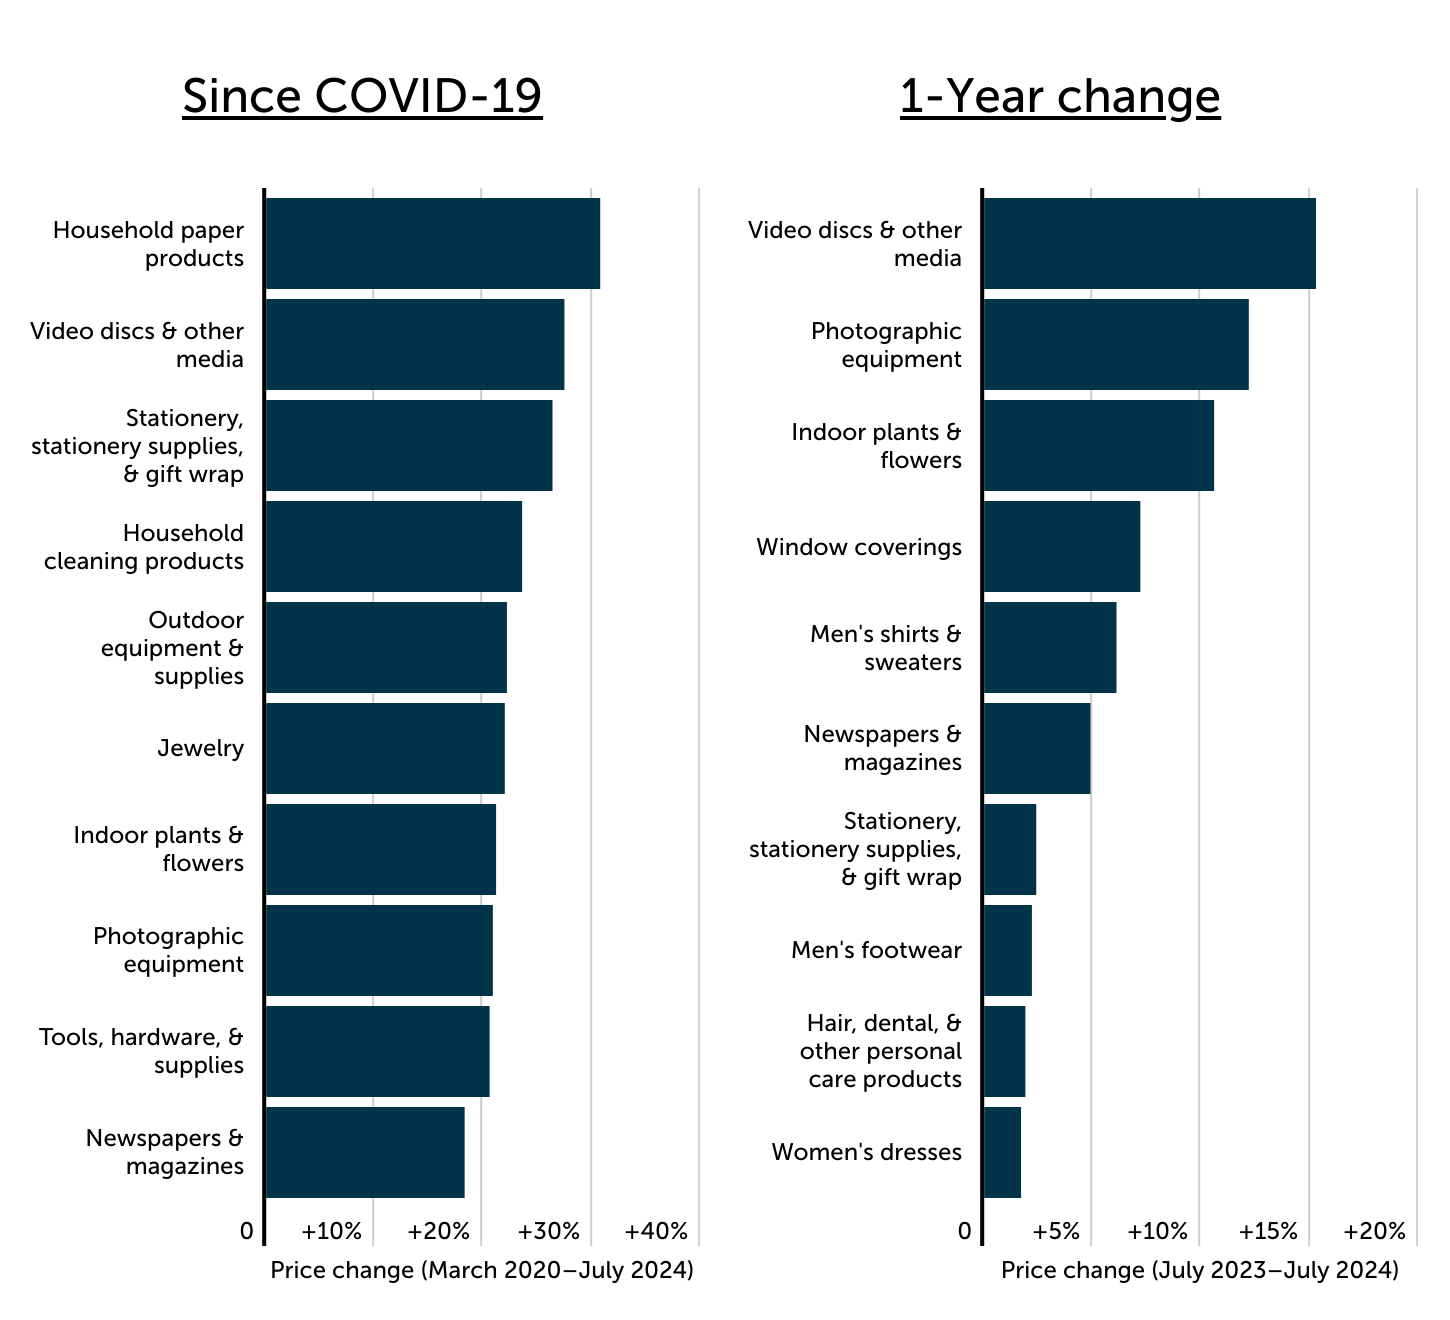
Household paper product prices have risen the most since COVID
Source: Trace One analysis of U.S. Bureau of Labor Statistics data
Though price increases have leveled out overall, consumers across the country still face the impact of both cumulative and recent price increases for household goods. Since COVID began in March 2020, nine categories of household goods have seen prices cumulatively increase by more than 20%, led by household paper products with a 30.8% increase. Over the last year, video discs and other media have stood out for a price increase of 15.3%, with other categories like photographic equipment, indoor plants and flowers, and window coverings also seeing prices increase well above the overall rate of CPI inflation.
Below is a complete breakdown of price changes for nearly 50 common household items, as well as household spending characteristics for all 50 states. The analysis was conducted by Trace One, a company specializing in regulatory compliance for the food and beverage industry, using data from the U.S. Bureau of Labor Statistics, Bureau of Economic Analysis, and Census Bureau.
Methodology
To determine the household items that have increased the most in price, researchers at Trace One analyzed the latest data from the U.S. Bureau of Labor Statistics’ July 2024 Consumer Price Index (CPI), U.S. Bureau of Economic Analysis’ 2022 Personal Consumption Expenditures by State (released October 2023), and U.S. Census Bureau 2024 Household Pulse Survey. Researchers ranked common household items based on their CPI percentage change from March 2020 to July 2024. For relevance, household items were defined to exclude food, beverages, automobiles, fuel, household services, utilities, pets and pet-related spending, education books and supplies, and tobacco products. Researchers also calculated two-year and one-year CPI changes ending in July 2024.
State-level data for spending on household items was sourced from the BEA and Census Bureau. The share of consumer spending allocated on household items was calculated by dividing the total personal consumption expenditures on furnishings, household equipment, clothing, footwear, telephones, computers, video and audio equipment, sports and recreational vehicles and goods, recreational reading materials, and other common household items by the total personal consumption expenditures. Due to data limitations, the household item spending calculations contain some minor services spending related to household items. The share of adults very stressed about recent price increases and the share of adults having difficulty paying for usual household expenses represents self-reported data collected and provided by the Household Pulse Survey.